- Profit Punch
- Posts
- 3 Simple Chart Settings That Will Help You Spot The Next 180% Winner
3 Simple Chart Settings That Will Help You Spot The Next 180% Winner
If you’re like most traders, you’re probably overwhelmed by all the noise in the market. Trust me, I get it. When I first started trading, I spent hours staring at charts, trying to figure out which moves were worth my time and which ones weren’t.
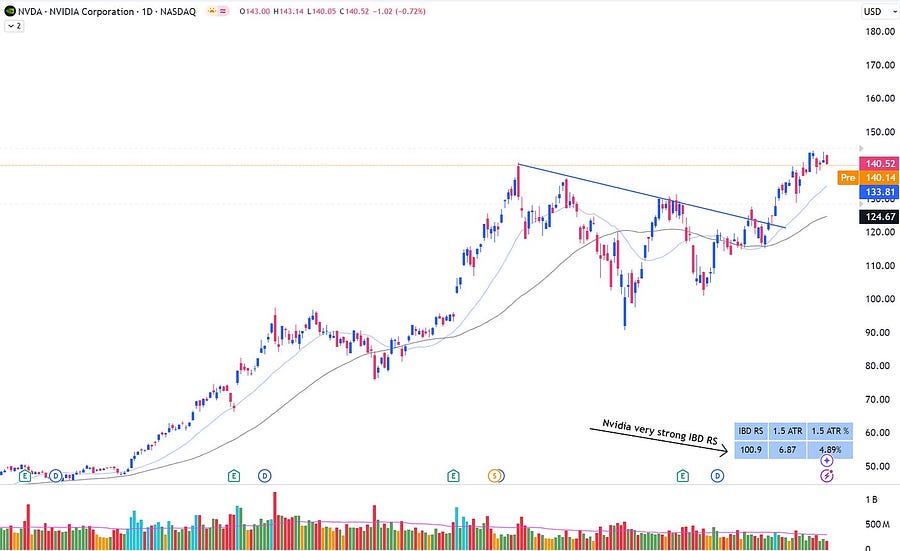
But here’s the thing — after years of trading and catching big moves like NVDA’s 180% rally and SMCI’s 240% explosion, I’ve learned that spotting massive trends comes down to three simple chart settings.

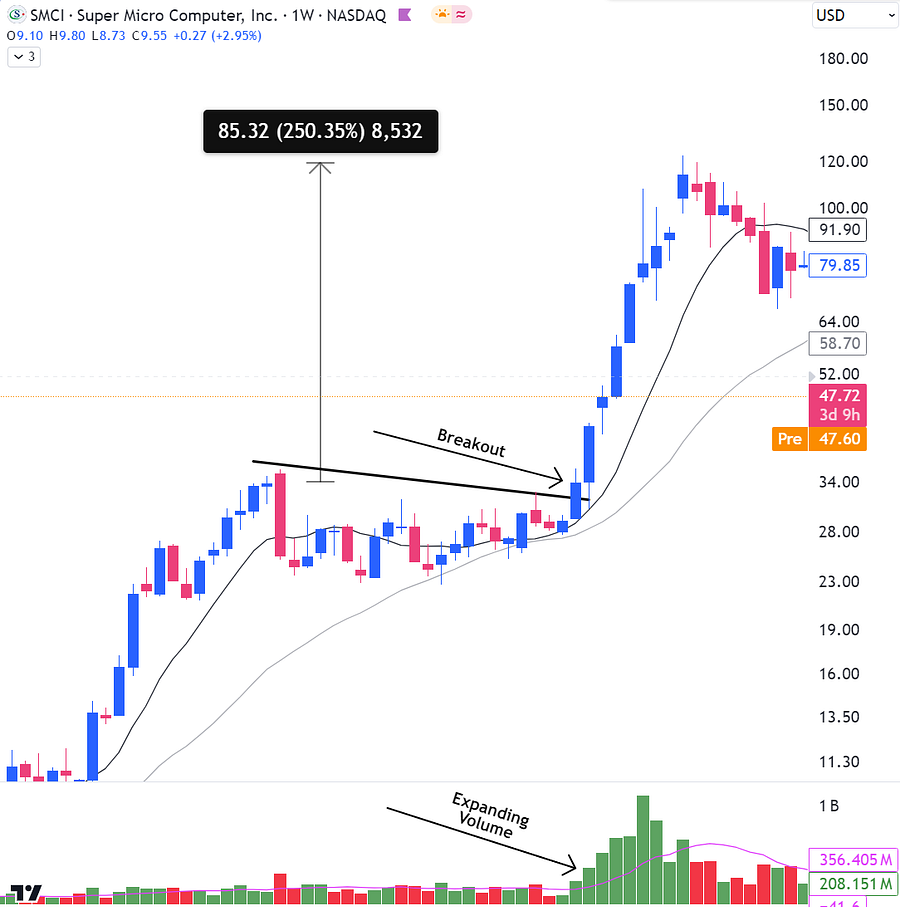
SMCI 250% Move
1. The Perfect Timeframe Combo
First things first — forget about looking at just one timeframe. Here’s my exact setup:
Primary Chart: Daily timeframe for entries
Secondary Chart: 4-day or weekly timeframe for big picture
Why? Because this combo helps you see both the forest AND the trees. The weekly chart shows you the massive trends that can deliver those 100%+ gains, while the daily chart pinpoints your perfect entry points.
2. The “Golden” Moving Average Setup
Here’s the exact moving averages I use that helped me spot the recent gold stock rally:
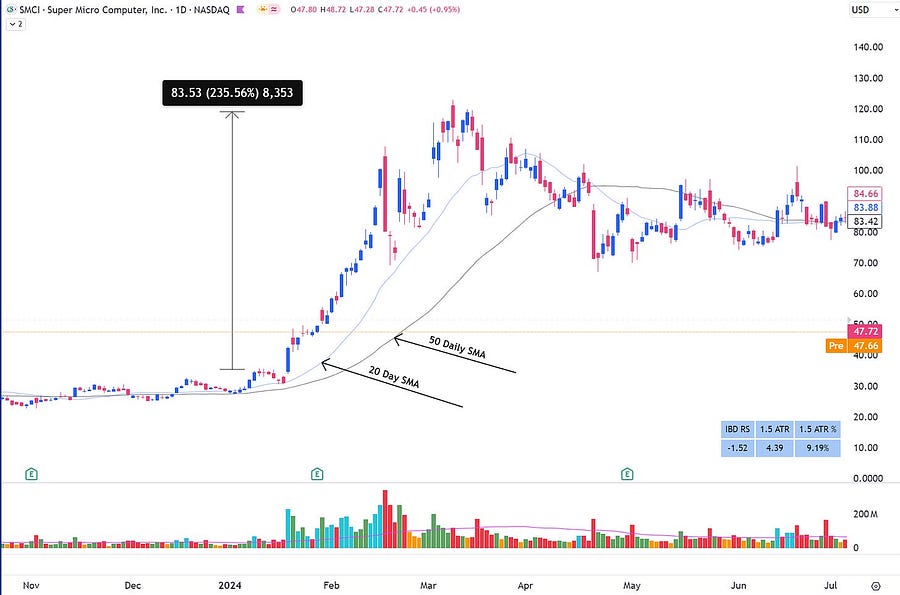
On Daily Chart:
20-day SMA (for immediate trend)
50-day SMA (for medium-term support)

SMCI Daily
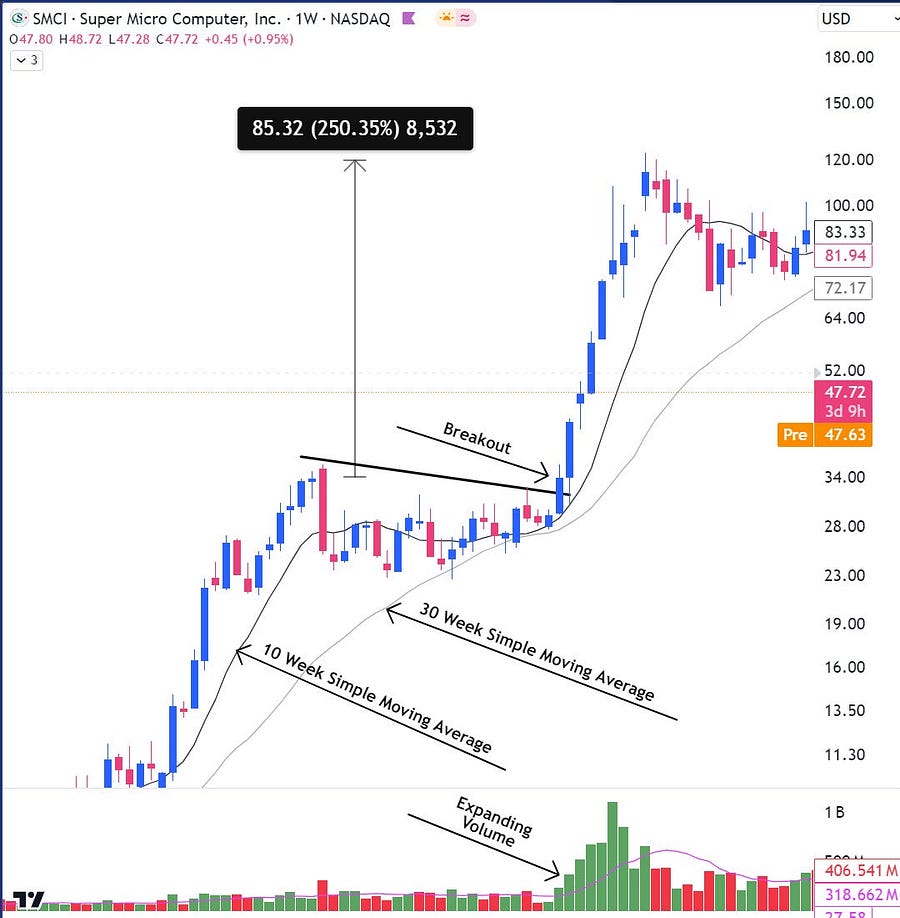
On Weekly Chart:
10-week SMA
30-week SMA (this is your major trend indicator)

SMCI Weekly
Pro Tip: When a stock bounces off the 50-day while the weekly trend is up, that’s often a perfect entry point.
3. The Secret Strength Indicator
Here’s something most traders miss — the IBDRS number. This simple indicator tells you exactly how strong a stock is compared to the entire market. Here’s how to use it:
Above 20: Stock is showing strength
Above 60: Stock is a potential rocket ship
Below 20: Stay away (unless it’s starting to turn up)
I never trade a stock unless it’s showing an IBDRS above 20. Period.

Time to Take Action
Start by setting up these three elements on your charts today. Focus on the strongest stocks (IBDRS > 20), wait for them to touch those moving averages, and watch how much clearer the market becomes.
Remember, the biggest winners often show themselves through these simple indicators before they make their massive moves.
Want more specific trading insights? Our Profit Punch members get real-time updates about stocks setting up with these exact patterns.
To your trading success,
Valentine
P.S. Next time, I’ll show you exactly how to use these settings to spot sector-wide moves before they happen. You won’t want to miss it!
There’s a reason 400,000 professionals read this daily.
Join The AI Report, trusted by 400,000+ professionals at Google, Microsoft, and OpenAI. Get daily insights, tools, and strategies to master practical AI skills that drive results.


Reply