- Profit Punch
- Posts
- The Pattern Behind SMCI's 240% Explosion (And How to Spot The Next One)
The Pattern Behind SMCI's 240% Explosion (And How to Spot The Next One)
Dear Profit Punch Subscriber,
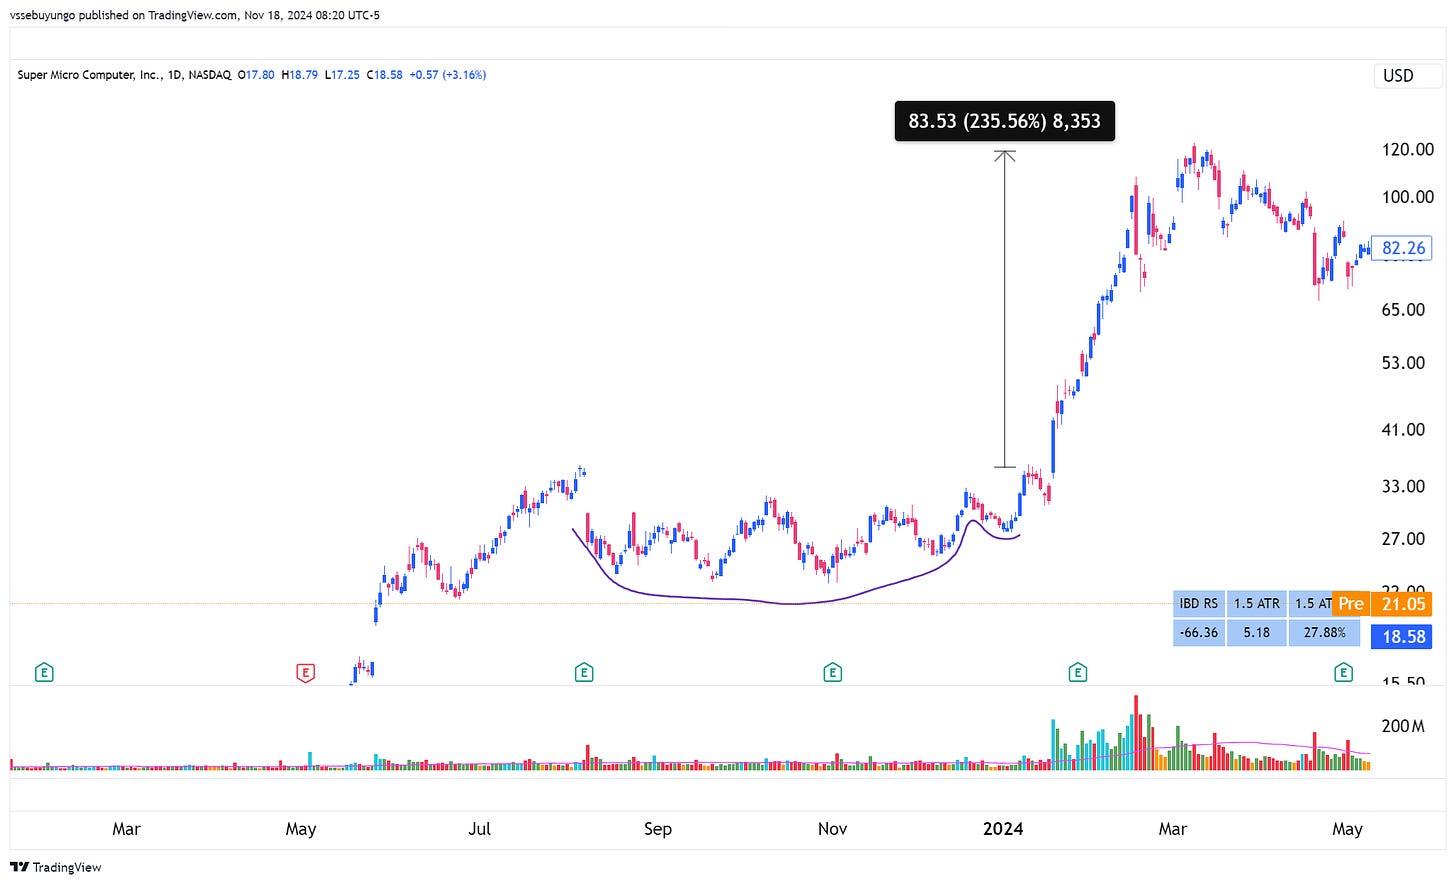
In February 2024, Super Micro Computer (SMCI) exploded 240% higher after forming this simple pattern I'm about to show you. While most traders were distracted by news and noise, this pattern quietly told us exactly when to buy—before the massive move began.
But SMCI wasn't alone. The same pattern appeared in CVNA before its 200% surge and FSLR before its 62% rally. Today, I'll show you exactly how to spot it.
Why This Pattern Works
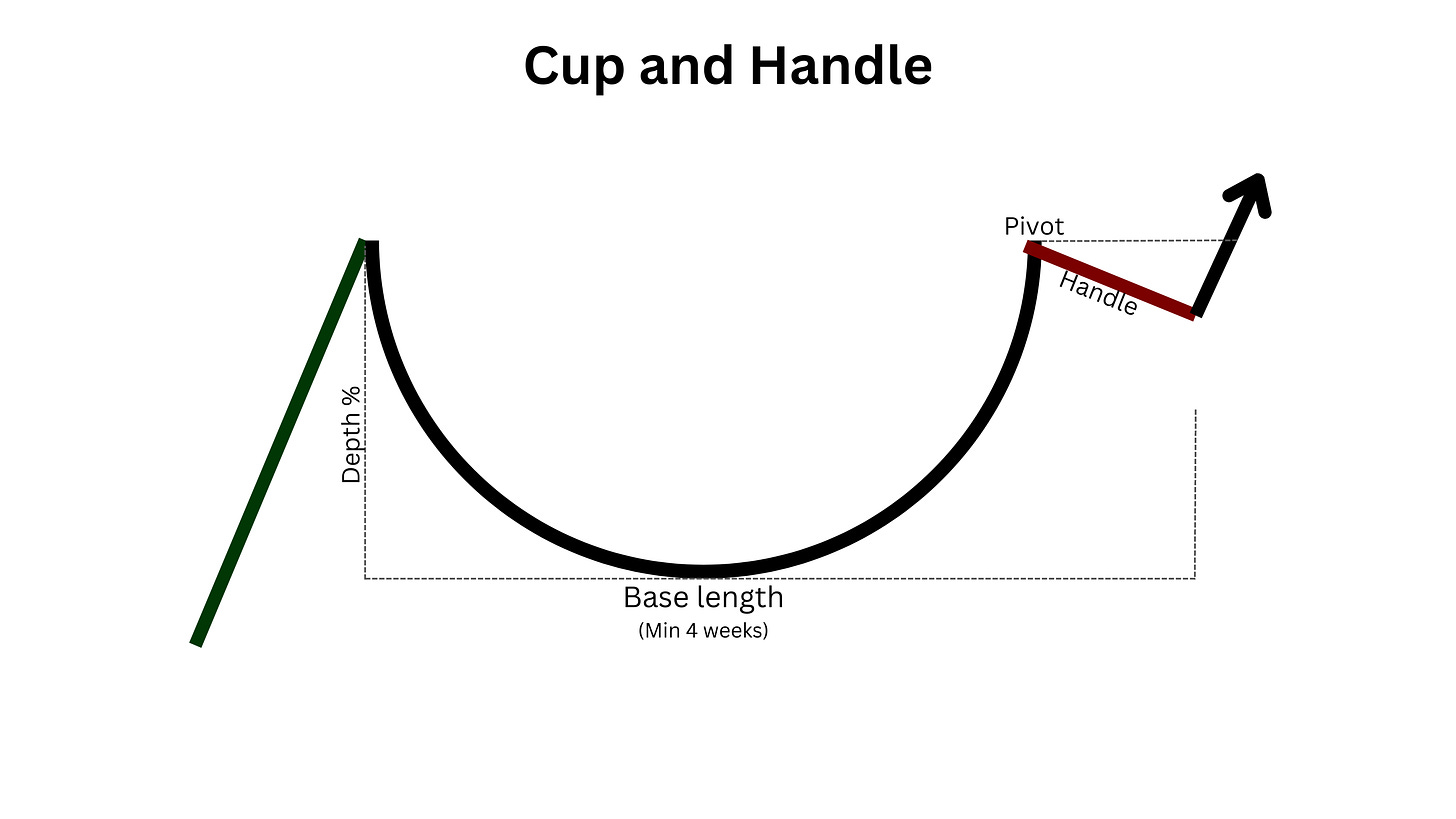
The Cup with Handle pattern works because it shows us exactly when big institutions are quietly accumulating shares. Here's what happens:
The stock pulls back as weak holders sell
Smart money starts buying, forming a "cup" shape
A final shakeout (the handle) flushes out the last weak hands
The stock explodes higher on huge volume
The Exact Pattern Rules
Here's your checklist for a perfect Cup with Handle:
✓ Minimum 4-week base formation
✓ U-shaped cup (not V-shaped)
✓ 30%+ uptrend before the base
✓ Handle drifts downward/sideways (never up)
✓ Handle correction: 8-12% maximum
✓ Decreasing volume in handle
✓ Volume surge on breakout

SMCI Case Study: The Perfect Setup
Here's exactly how SMCI played out:
Cup formed over 6 weeks from $250 to $350
Perfect U-shape with declining volume
Handle formed with 10% correction
Breakout at $375 on 73% above-average volume
Result: Stock hit $1,000 in 50 days

SMCI Split adjusted Daily
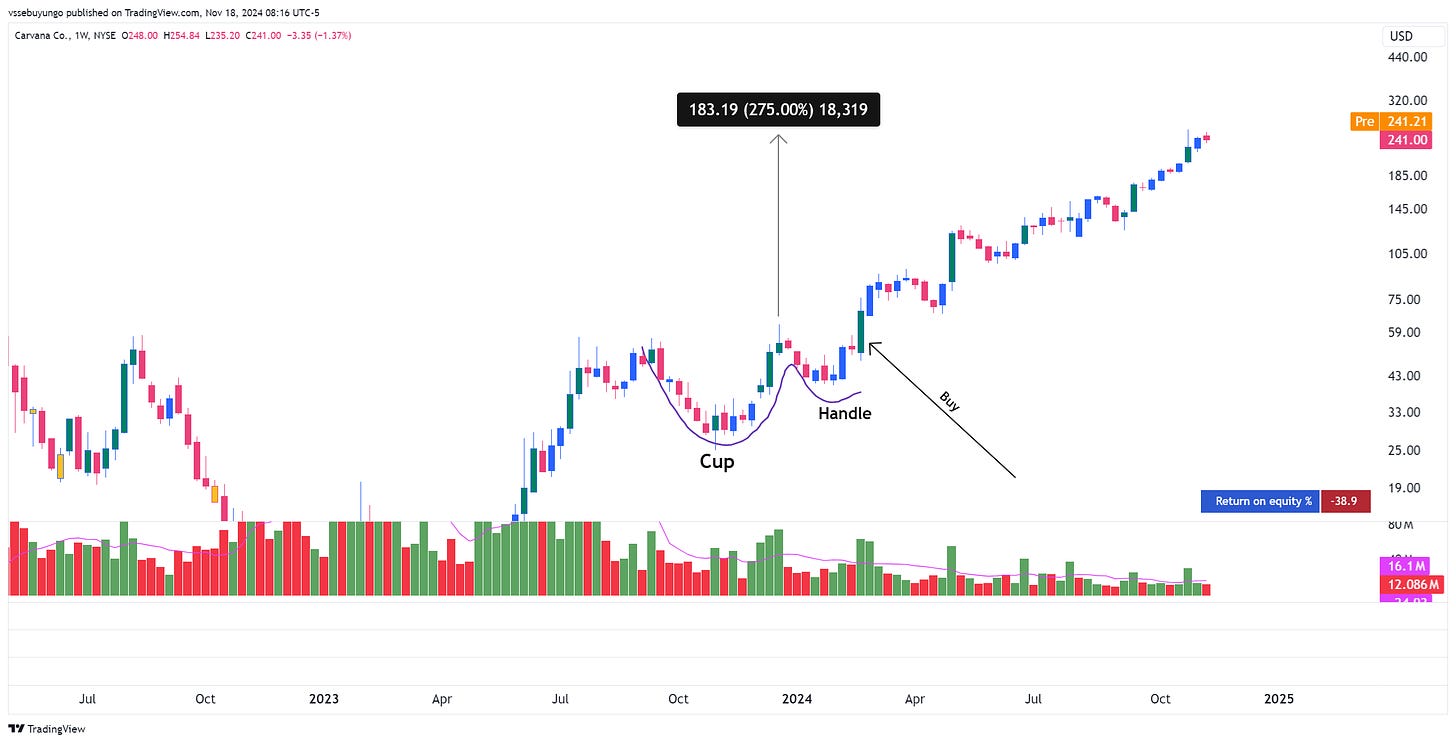
CVNA: The 200% Monster Move
8-week cup from $25 to $45
Tight 2-week handle with volume dry-up
Broke out on earnings with 92% above-average volume
Surged from $47 to $115

CVNA Daily
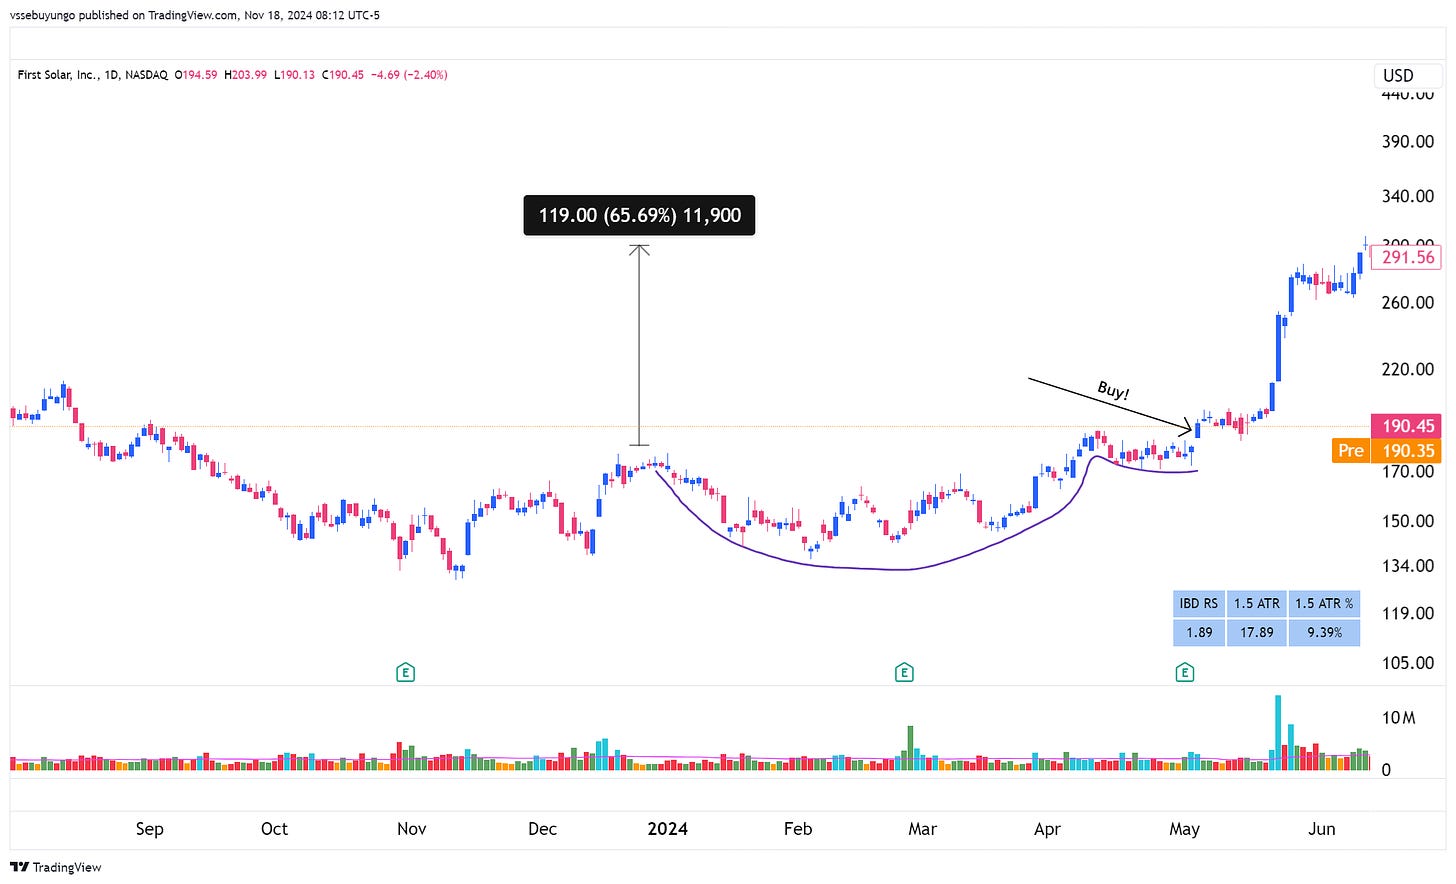
FSLR: The "Textbook" Trade
Classic U-shaped base
Handle showed perfect volume contraction
Buy point: $185
Stop loss: $172 (7% risk)
Target hit: $300 (62% gain)

FSLR Daily
Your Action Plan
Scan for stocks 30% off their highs
Look for U-shaped bases lasting 4+ weeks
Wait for handle with decreasing volume
Enter when price breaks above handle WITH volume
Risk maximum 7-8% below entry
First target: 20-25% above entry
Let winners run with trailing stops
Warning Signs to Avoid
❌ V-shaped bases (too sharp)
❌ Handles correcting >12%
❌ Upward-drifting handles
❌ Weak volume on breakout
❌ Less than 4 weeks of base
Next week, I'll reveal the exact pattern that preceded NVIDIA's move from $50 to all-time highs. Don't miss it!
Trading With You,
Valentine
P.S. Want these setups delivered straight to your inbox? Join Profit Punch Premium and get my exact entry/exit points every morning before the market opens.
Reply